Thursday 6 December 2012

New toys are inspiring


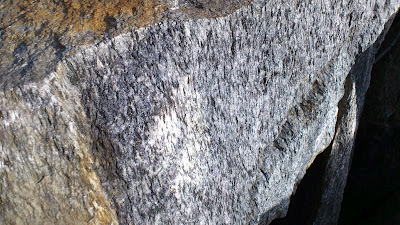
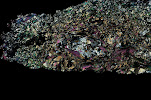
I have always been a visual person, and one of my favourite parts about being a petrologist is the pretty photos of thin sections that I have collected.  I also love organizing stuff—I was one of those kids who had even more fun sorting my legos by colour, size, and type than I did actually building things out of them.  However, until this week, it had never occurred to me that it would be possible to do visual organization of my photos.  Oh, sure, I had some organization of my sample photos—a folder for all the thin section photos, and sub folders for each sample. Another folder for photos of drill cores, with sub folders for each drill hole, and under those more sub folders for each box of core (since when using my phone I need to take nine photos per tray of core in order to photograph every bit of it.

But that was where my organizational system stopped.  If I wanted to do something like, gather together all of the rhyolite samples and look to see if they were similar or different to one another I would open the spreadsheet of samples, sort by rock type, then, one sample at a time go through the folder of photos for each sample, import it into my drawing program, add text, insert a new page for the next sample, repeat.

Then I read a blog post by my favourite medieval textile scholar describing the photo organizational database she uses.  She mentioned that one can store photos in a folder yet, at the same time, have “albums” to organize them, and the possibility of one photo belonging to more than one album, without duplicating the photo. Her description of being able to define smart albums based on key words associated with the photos caught my attention, so I went off and got a copy of the program.

Doing this has really re-inspired me to work. My partner and I recently bought a house, and a rather large part of me had been resenting “work” as something that was interfering with important things like getting the house unpacked and organized, and exploring the forest outside of our door.  But now I am keen to come into the office and play with my photos and organize them. I am actually looking forward to writing papers, because choosing the right image to show the feature I describe in the text will be so easy with this tool.

So far I have created albums for each drill hole, and sub albums within the drill holes for the individual samples. I have copied all of the notes I took for each sample into the album description, so I can see at a glance which phases are present, what rock type I assigned the sample to, where the sample comes from, and so much more.  I am adding key words to my samples so that I can later ask to see all photos containing feldspar, or pyrite, or whatever, and I will get them.  The program lets one select multiple photos at once and apply key words to them all at one go, which saves time.

One bit of advice if you decide to do something like this:  Decide on your key word pattern as early as possible.  My photos are marked with a variety of types of key words, and my first attempt I just typed in useful words like “PPl”, “XPL”, “folded” “Qtz”, “10X” etc. But then I realized that one can add key words from a drop-down menu, which is sorted alphabetically.  After I made that realization I added a type code to the front of the key words, and now I can specify if the key word is a “drill hole”, the “scale”, a mineral (“min”), a phase that only shows up in this sample as inclusions within another mineral (“inc”), the rock type, structure, or any number of other categories that I will come up with later.  This makes choosing the keywords much easier, as they are now grouped together, so I can click on the one I need.

Monday 17 September 2012

Importing Air Photos into Leapfrog


Some time back I received some air photos of the region I am currently working in from one of my colleagues. Last week I discovered that it is possible to easily import those photos into the program Leapfrog and thus see the lay of the land with respect to the locations of the various drill cores. However, he gave me six different photos but I only received corresponding “.tab” files for three of them. It is the data in the .tab files that tells the program how to import the photos—where are they located.  Therefore I set myself a quest: work out how to create .tab files for the other photos.  Having learned a number of things in the process, I thought I would share them here.

Step One in the process is deciding what points you want to use as markers.  Choose a place on the photo that is easily recognizable (like a cross-road intersection).  Then open GoogleEarth in one window and the air photo in another (using two monitors at once really helps!).  Zoom in to the selected location in google earth, and click on the thumb-tack shaped icon to get a marker. Drag that marker to where you want it, and give the marker a name (such as “T-intersection, upper left corner of Airphoto_a.jpg”), and save the location.  You can now look up the latitude and longitude of this point by clicking on it and selecting “properties”.

Step Two is to use an on-line form such as this one  (option: “Transverse Mercator Calculator”) to convert the latitude and longitude into the Swedish national grid known as RT-90 (that is the format of the drill hole locations with which I am working—if you are working in a different area you will need to instead convert to the appropriate coordinates for your area).

Step Three is to determine the X-Y coordinates on the photo itself of the selected location.  First look up the size of the photo by importing of it into Leapfrog without worrying about the fact that there is not yet a .tab file for it.  Then right-click on it to open the properties dialogue box and make note of the photo size (mine happened to be 1404 wide and 940 tall). (It is a good idea to now delete the photo from Leapfrog, since it is not, yet, in the correct spot). Now that you know the photo size that Leapfrog will be using, import the photo in CorelDraw, and change the size of the photo to those values.

Now you are ready to for Step Three itself: Use the “guidelines setup” dialogue box of CorelDraw to create two guidelines, one horizontal, one vertical, both located at zero. Then turn on the “snap to guidelines” feature and set the photo so that the upper left corner of the photo is located at the newly created 0,0 intersection.  At this point it is a good idea to “lock” the layer the photo is on so that you do not accidently move it during subsequent measurements.

Now that the photo is properly positioned drag new guidelines onto the photo such that they intersect at the spot you selected in Step One. Re-open the “guidelines setup” dialogue box and edit the position of those lines to the nearest whole number (e.g. 57.3456 becomes “57”) and look at the revised position to be certain you are happy with the location of the intersection of the guidelines.

Step Four: edit a .tab file with the numbers determined in Steps Two and Three.

The files he gave me have this format:

****************************
!table
!version 300
!charset WindowsLatin1

Definition Table
  File "airphoto_kriberg_a.jpg"
  Type "RASTER"
  (X,Y) (A,B) Label "Pt 1",
  (X,Y) (A,B) Label "Pt 2",
  (X,Y) (A,B) Label "Pt 3"
  CoordSys Earth Projection 8, 112, "m", 15.8082777778, 0, 1, 1500000, 0
  Units "m"
 ****************************

Where X and Y are the east and north coordinates of each spot in the RT90 format (Step Two) and A and B are the positions on the photo itself (Step Three).  Edit this to have the numbers you determined above, and repeat for two more spots on the photo.  Save as a .tab file in the same folder as the photo itself.

Step Five: import into Leapfrog.  If you edited the .tab file correctly choosing the “import image” option will open up a dialogue box that shows a circle, a square, and a triangle each superimposed over the photo on one of the three points of interest you selected. If they are in the correct spot click “ok” and your photo is imported.  If you don’t get a dialogue box but only an error message one possibility is that you could have introduced a blank space after the coma and before the next number. This is easily solved by deleting that space.

There may well be a simpler way (more automated) way to create .tab files for importing air photos into Leapfrog. If anyone knows of one do please share in a comment.  In the meantime writing down what I did will help me remember next time I need to do this.

Monday 30 July 2012

Tasmanian Metemorphic Geology; It is wilder than you think.


This morning I received comments from reviewers on the manuscript I recently submitted.  I was delighted to see that they recommend that the article be accepted, after minor revision.  Even more than that, I am very happy that one of them took the time to actually read the text closely enough to catch some important typographic errors.  Of all of them that he found, my favourite is:  "...rocks wildly distributed throughout Tasmania". 

While, I have, on occasion, used the term “in the wild” when referring to rock types I have personally seen on a outcrop in the field (as opposed to in a rock collection in a lab or museum), I am quite certain that what I was thinking when I typed that phrase (and must have thought I saw on every subsequent re-read of the manuscript) was “widely distributed”.  My thanks to this reviewer, and to all reviewers who take the time to be certain that such errors never make it to the published version of a document.

Friday 27 April 2012

What about GeoSociety journals?


There has been a fair bit of attention recently in the media and on science blogs about the evils of the academic publishing industry and how much profit the publishers get for all of the unpaid work that scientists provide in terms of writing, editing, and reviewing the content, combined with a cry for academics to consider publishing instead in open access journals.  This suggested solution makes a certain amount of sense to me, but I find myself wondering about the journals which are associated with Geologic Societies (for example the Australian Journal of Earth Science, which is available to members of the Geological Society of Australia, or Elements, which is available to members of number of Mineralogical societies in a variety different countries).  These journals are not open access, but the memberships base of the societies are, sometimes, very extensive, and some of these societies have reasonable membership rates.

For those of you who are actively participating in the boycott of journals which are hidden behind a pay-wall, how do you feel about journals which are associated with such societies? There is still a pay-wall, and in some (all?) cases there is a professional publisher which does the publishing on behalf of the society (Taylor & Francis and GeoScience World  for the above two examples).  Does the fact that the journal is one of the perks to membership in the society help alleviate the concerns about paywalls?  Are these sorts of journals handled any differently than those which are only for profit of the publisher?

I am wondering about this because I am just about ready to submit an article for publication, and the most logical journal for that particular research happens to be AJES. Therefore I would appreciate hearing other people’s thoughts on this subject.

Wednesday 21 March 2012

yet another academic publishing blog

I have seen a variety of other blogs discussing the problems in the academic publishing system, with many discussions as to *why* the system is continuing to thrive, depsite the presence of the internet having rendered most of the services provided by publishers obslete. However, none of the discussions which have crossed my path address what, to me, is likely the biggest reason. As scientists our publication records matter—if we don’t have “enough” first-author papers published we don’t land jobs in acaidmeia, and we don’t get grants if we have jobs. The universities for which we work are ranked, in part, by the number of publications we produce, and the quality of the journals in which we publish. The more “A” ranked journal articles produced by a given university, the better it is considered to be, and the easier time it has of getting funding. So long as funding decisions are based, in part, on our list of publications, and so long as the prestiege of the journals in which we are publishing matters, the system will continue to thrive, despite so many of us being unhappy with it. Is there hope of this changing? Perhaps, if enough people want it to change.

Tuesday 20 March 2012

Geology field trip at Arlanda airport


The next time you have too many hours to wait for your next flight at Stockholm-Arlanda airport why not step outside and have a short geology field trip?

I had a long layover on my way to France, and it was much too nice of a spring day to spend the wait inside. The first thing I noticed when I stepped outside is that spring in southern Sweden is much further along than it is in the north. At home the snow was still fully covering the ground, though starting to get soft and melty. Down here there is no snow left at all, though the flattened, yellow state of the grass attests to the fact that there was snow on the ground fairly recently.ere is

I set out from Terminal 5, following the bike/walking path to the
left from the building (note: use the exit on the lower floor; the sidewalk on the upper level dead-ends at the top of the driving ramp to the loading zone). I found the first outcrop straight away: a tall chain-link fence protects unwary travelers from falling over the edge of a small, man-made cliff.


Not being able to resist the allure of a fresh rock surface, I promptly left the trail to investigate. The cliff is actually a channel cut into the rock which ends at a large garage-door.


The rock here is fine grained, dark, and contains small veins, some of which cross-cut one another. The weathered surface shows a bit of foliation to the rock.


The astute observer might notice that along the fence edge there is a bunch of rubble fill which is made up of a coarser grained white rock with elongate black grains showing a foliation.


However, the wait for my flight was quite a long one, and I still wanted to stretch my legs, so I decided to continue my exploration. I continued following the path, turning left at the Statoil station and continuing along the path towards the forest in the distance.

After a short walk I came to a body of water which had an earth-bridge crossing it, leading towards a small hill with rocks exposed at its peak.


What geologist could resist? Closer investigation revealed the source of that white and black rock that is being used as fill everywhere between here and the terminal.


There are plenty of fresh surfaces to admire, sparkling in the sunlight on the side that has served as a quarry.


There are also plenty of examples of how the rock looks 'in place' on the other side of the hill.


It took me only 35 minutes to walk from my gate to the quarry outcrop, and I recommend the adventure to other travellers with time to spare who would rather enjoy fresh air and investigate the local geology than explore the over-priced airport shops.

And to show how far apart the two outcrops are: The view back to terminal from the further outcrop:

And how close the nearer outcrop is to the same control tower:


Thursday 8 March 2012

WoGE # 334


I have been seeing various posts from the Where on GoogleEarth game wandering hither and yon over the geoblogosphere for years now, but never really felt like I had time to play. I did once open GoogleEarth and spend something like 1 minute looking around before deciding that my time that day would be better spent actually doing the tasks for which I had turned on the computer in the first place. Yesterday, however, I decided that it was time to actually give it a go, so when I saw Zane’s post announcing #333 and noted that no one had yet posted an answer (though Florian at EffJot had indicated that he was only waiting for hi

s Sc

hott rule time period to elapse before he posted his answer), I downloaded GoogleEarth (no, I hadn’t gotten to that yet—I only got this computer in November, and hadn’t yet needed it—for quick looking GoogleMaps is adequate).

Now, I was lucky with this one—coast lines narrow the search quite a bit, and the style of agriculture and architecture looked sort of English to me, which meant I could focus my search on Britain and places colonized by them. Even so it took a while to find the location, at the mouth of the Wairoa River in New Zealand (North Island). Once I found it I refreshed the page and saw that there were no new comments, so I started a comment of my own,
describing the location and geology. Now, since I am not a sediment person this means that I also spent a couple of minutes consulting with google to find a paper on the geology of the area, so that I would have something to say on the topic.

Once I was done I hit the button to post the comment, only to discover that Florian’s answer had appeared nine minutes before mine. It was a fun game, but I lost, fair and square, and I was quite delighted to have been able to find the location on my first try of playing. However, Florian, being a generous soul argued that given the closeness of the timing of the posts the win (and obligation to host the next one) should go to me. Astute readers will
note that since he had been waiting to post until his time limit was up it wasn’t, truly, that close—he knew the answer before I started looking. Be that as it may, after a bit of discussion he and Zane both agreed that I should take the next go at hosting.

Therefore, without further ado, I introduce you all to Where on GoogleEarth #
334:


I am looking forward to hearing what you can tell me of the geology in this area—from the little I read before selecting this spot you should be able to share some interesting tidbits. Since I directly benefited from the Schott Rule it seems fair to not invoke it this time, so, come on you multi-winners, show us how it is done!

The scale bar, which I drew onto the above image myself, is roughly 5 km long; I didn't know how to get a scale bar to appear automatically in GoogleEarth. Fortunately, it turns out that there are instructions available for these things. Pity I didn't think to look for them before posting this morning. Oh well, this is why it is possible to edit posts.


However, when I made the above image, by using the handy "snip tool" on my computer and saving to jpg, adding a scale bar in a drawing program, and re-saving, the result turned out not to be clickable to make a larger image. Thanks to the below comment, I now know that one can save right from GoogleEarth (see, I told you I wasn't very experienced with the program, it didn't even occur to me to try). The new, improved image is below. Hopefully this time it is possible to zoom in enough to see details.


Nope, not yet. Perhaps I am doing something wrong in blogger when I upload them? At least it has the scale bar, which is 7.01 km long, since I couldn't get enough accuracy with the mouse on the slide bar to get it to stop at 7.00 km. Thanks to the kind help of Florian (see comments) there is now a full size version available over here.

Tuesday 6 March 2012

writing grant proposals gives the writer more benefits than just the potential money they represent

My focus the past few weeks has been preparing a grant proposal. This is my first attempt at a major, multi-page, grant proposal. I have done minor proposals in the past—the field work for my master’s project was funded with a small GSA grant, and I have obtained a fair few travel grants over the years. Indeed, before submitting this proposal I was in the happy place of being able to truthfully state that I have received 100% of the grants for which I have applied. Needless to say, in addition to wanting this proposal to be successful because of what it would mean to my ability to do science (many of the steps in the process are expensive), that past success rate means that I am even more keen to have this application succeed, since it would be lovely to keep the 100% successful rate for a bit longer.

What have I learned about the grant-writing process? Well, for starters it is very good that I did the initial submission of the application a full week before the deadline, even though I knew that I did not yet have all of the information from my boss that I needed. Why? Because I had forgotten, until I saw that section of the webpage, that a grant application, like job applications, require letters of reference. By doing the submission of the first draft of the paper a week early it gave me the opportunity to remember that important detail, and to contact my referees to ask if they would be able to write a letter before the deadline. How would I have looked if I had had to write to them with only a few hours to spare before the deadline? (Note: the letters of reference have the same deadline as the application itself. If they don’t get it in by then their words will not be heard by the review committee. However, the web page is kind enough to email us applicants when our letters of reference are uploaded into the system, so that we know that they are done and don’t need to worry about that part.)

What else have I learned? There are three sections to the application packet. The first is where you describe the planned project: why it is scientifically interesting and why humanity will benefit from the project. The second is where you describe the scientist(s) who will do the research (that would be me, in this case) and explain why my background makes me the perfect person to do this particular research, and the third describes the institution at which the research will be conducted and why it is the perfect place to undertake such a project. Not surprisingly, I found the first two sections easier to write than the third, since I am so new to this institution. Fortunately, my boss was able to provide me with much helpful information to make the third section come together as it should.

I think that the thing which most helped me with this grant application process is all of the many job applications for academic positions I have done over the years since my PhD first started to draw to a close. The two processes are very similar. However, all in all, I think I have a preference for writing grant applications to job applications—there isn’t quite as much riding on it. If I don’t get this grant I still have a job, I still continue to eat and have a roof over my head. In this particular case I even still get to do the research I speak of in the proposal, since this grant is aimed at researchers who already have an employment contract and a project in progress, but wish additional fund so as to improve the list of what they can accomplish in the process. This level of security permits me to be happy about what I have accomplished over the last few weeks of working on the application—I now have an even better understanding of what my research will entail and how and when I will accomplish various tasks. Even if for some reason my grant is unsuccessful I still gain immense benefit from the process of writing up that work plan and the abstract saying what I will be doing. Besides, you never know—mine might be one of the applications chosen for funding. If I didn’t ask they wouldn’t be able to tell me ‘yes”.

Thursday 1 March 2012

not late at all, measuring with a geologic time scale


As the rest of the geoblog sphere is busy offering up their entries to this month's Accretionary Wedge, I am finally able to offer my entry for last month's call.

Why a month behind? Because the call went out while I was in Scotland, and the counter top, ok, floor, I wanted to photograph was in Sweden. So I had to wait till I got home, and then I had to wait another couple of weeks before I found time to head to the city center to get the photos, and then I had to wait till I had time to actually upload them. However, I think you will agree that this particular building stone was worth the wait.

This is the floor at my eye doctor's office, and what a lovely floor it is. Look at the garnets! Look at the banding! I would love to know the location of the quarry that produced this rock.

Wednesday 25 January 2012

a new (to me) sort of sample collecting

Sample collecting. It is something that we geologists have all done. It isn't enough to look at rocks in the field, we need to bring them home too, if we want to answer the questions that come up in the field. My current job, however, doesn't yet have field work in the traditional sense. Instead my “field” is the collection of drill cores which have been amassed over years of exploration and mining in this district. I have just completed my first two “field” trips to look at this core, which is to say I have been introduced to the core storage shed at the mine headquarters. Last week and the week before I worked with one of the geologists in the exploration division of the mine office. We looked at four different drill cores to select representative samples at roughly 50 meter intervals to be sent away for geochemical analysis.

This is an interesting task—my project will involve 3D geochemical modelling with the aim of understanding the alteration that has happened to the rock in the region during the process of the formation of the ore deposit. Therefore we need to be certain the samples we choose have been altered, but that the alteration that has taken place in these rocks is related to the main alteration event of interest. Therefore we want to avoid the sections of drill core which contain small veins which cut across the fabric of the rock (which means that they formed well after the deformation that caused the main rock fabric, and so are younger, and so probably aren’t related to the question I am trying to investigate). Because my project will be on the kilometer scale we don’t want to take the samples too close together (hence the 50-meter interval rule of thumb), but then again there is value in making certain that we have a good representative collection of samples that actually show what rock types are present in each drill hole.

This is easier to do for some drill holes than others. You see, drill core comes in different diameters, based on a variety of factors when they do the drilling, but the boxes into which they store the core are fairly uniform in size. This means that one box will hold more meters of narrow core than it will wide core. We sampled 4 different drill holes over the two weeks I was there—the narrowest core tended to be 10 or 11 meters of core per box, but the widest one was less than 5 meters of core per box (the other two were about 7 meters each). The tables upon which we spread the boxes hold 10 boxes at a time, which means we could view 50, 70, or 100 meters of core at a time. Needless to say, it is much easier to decide what rock types are “typical” for a given stretch when we can see more of the core at once.